Saturday, July 4, 2015

Bovespa all set to fall !

Brazil stock market Bovespa is all set to fall . My stat arbs and technical analysis have indicated weakness in the market.

Stat arbs have forecasted Bovespa to trade 45000 in the next 3 months. This is also inline with the H&S formation on monthlies and weeklies . First of all the right shoulder of the H&S has tested a major 4 year trendline coinciding with a 75% Fibonacci resistance. The failed test has resulted a reversal from 58000 to the current price 53000. The H&S neckline rests at 45,000.

 From fundamental perspective Brazilian interest rate are relatively high for a sustainable economy and the currency is at a multi year low against the USD. The global market sentiment  doesn't support Brazil either with continued risk due to Greece.

Short Brazil (Bovespa) 53000 for 45000  in 3 months time i.e looking for min 15% selloff.

Friday, May 15, 2015

GBPJPY all set to test 200 !


Sorry folks not been updating my blog for ages, been very busy with few other things. So here it is, my stat arbs have indicated GBPJPY is all set to breakout thru major trendline resistance and test multi year trendline at 200.  Strong support for this week is expected at 186 which is the monthly trendline breakout and will set the way for 196 and 200. 


Wednesday, August 27, 2014

DAX to make a strong finish by year end !

On 11th July, I  highlighted the fact that US30 yr Bonds will rally and  target 141.50. Further a bearish equity note indicating equity indicies especially DAX ..

Since the note was posted  US 30 Yr traded 141.50 and DAX corrected lower by 10% . My weekly and monthly model forecasts have now indicated a very strong rally in Equities into the year end especially DAX  to trade 10500.

The US conterparts are already trading at life time highs whereas DAX is lagging. ECB easing is likely to boost liquidity amongst European banks and support growth in coming quarters. Overall growth in developed nations especially US & UK will have a positive spillover effect on Eurozone sooner or later. Hence the catchup theory calls for a Long DAX on dips strategy targeting 10500 by year end.

If you are a chartist and follow charts on a monthly and quaterly scale then the current bounce from 8900 level on Dax will appeal you.

best of luck traders.

Thursday, August 21, 2014

AUD & JPY crosses risks lie to the upside breakout.

Buy AUDCAD 1.0180 Stops 1% for 1.0300
Buy AUDJPY   96.00 stops below 95.00 depending on your risk appetite as the pair heads to 99.50
Bullish USDJPY forecasts from my weekly model with initial target 104.70/105.00 and depending on the monthly close in August potential for 107. i.e if Monthly close in August > 105 then very good potential for 107.

I am relatively bullish AUD and bearish JPY hence AUD/JPY does the job for me.


Friday, July 11, 2014

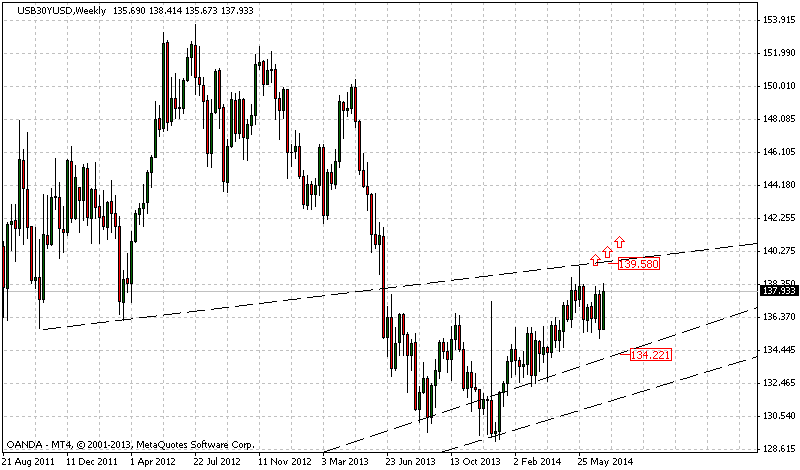
30 Yr US Bonds upside breakout risks !

Timespan for strategy validity based on in-house model - 2 Months.
Key decision drivers - long term trendline support bounce , Weekly stat arb indicating upside breakout potential .

Daily close above 138.50 and a weekly close above 139.50 does the job. Overall the strategy can be fine tuned by looking out for long setups in 135.50 region and stops below 134 to target 138.50 at first and then larger targets like 141.50.

30 Yr bonds have been finding decent enough support in 135.00/50 zone for the last 2-3 months hence a stops below 134.00 is ideal and justifies the technical setup.

On a fundamental perspective my Dax Index model has shows signs of exhaustion along with few other equity indices like Dow, Bovespa, BSE which may imply a consolidatory to slightly corrective (lower) phase in equities sending bonds higher.

Overall my directional view on 30 yr bonds for the next 2 months is Bullish .


RV Trade Short ZAR against a basket of INR & MXN - Reform Trade

Last few quarters have been extraordinary for EMFX especially countries running the risk of higher current accounts(deficits), political risks.

Long MXNZAR @.8100 stop 0.7900 for 0.8500
Long INRZAR  @ 0.1755 stop 0.1710 for 0.1810 and 0.1900

I like to call this the reform trade. The expectations of investors from EM governments to push in new reforms has been higher than ever. Firstly it was Mexico with its oil reforms and recently expectations from Modi's Indian government. The recent  trend has been, the inflows to buy Indian equities and bonds with the 'expectation' of change and implementations of new reforms. A similar trend can be noticed in Indonesian equities with the expectations of new government and possible reforms. Later this year investors expectations from Brazil should reflect in Bovespa and BRL.

On a relative basis South Africa is severely lagging in terms of new reforms to kick start the economy or increase investor confidence. SARB is relatively dovish on its monetary stance as growth has fallen. The current account deficit remains a concern when compared to likes of Mexico or even India which has managed to reduce it remarkably.

There is a carry potential on Long INRZAR whereas a slightly negative carry on Long MXNZAR.

The chart above is INR/ZAR Monthlies and it is evident that the pair has found support on the long term support trend line at 0.1750 after consolidating for approximately 5 months and now heads higher to top of the range trend line resistance of 0.1920.  My in house models do agree with the setup which is a plus.


The chart below is MXNZAR monthlies. 0.8000 has been a multi year resistance line which has been tested aggressively in 2008-09' but failed to trade above. Last quarter of 2013 the pair finally closed above 0.8000 and since then has been finding support at 0.8000. I think there is potential for 0.8500 for this trade which is the topline resitance. Again my models do agree with the forecast. Overall there lies plenty of scope trading the big range 0.7500-0.8500 depending on the risk profile one has and how he perceives the incoming macro data.

Tuesday, July 1, 2014

EMFX Currency Charts- Risk lie to upside short term !

Cautious on EMFX short term possibly till end of July. If you are following my posts since May 2014 you will notice a  short bias in emerging market currencies especially INR (post election).

The following charts are long term however the daily formations and intra-day price action off this major trendlines should not be ignored! Also notable three day bank holiday coming in the US so I would expect the vols to kick in next week or so. Time to buckle up the seat belts..


Daily 10YR TRY Yields basing out at 8.50 support.